
The Department for Work and Pensions Claimant Service and Experience Survey (CSES) is described as “an ongoing cross-sectional study with quarterly bursts of interviewing. The survey is designed to monitor customers’ satisfaction with the service offered by DWP and enable customer views to be fed into operational and policy development.”
The survey measures levels of satisfaction in a defined group of ‘customers’ who have had contact with the Department for Work and Pensions within a three-month period prior to the survey. The research was commissioned by the Department for Work and Pensions and conducted by Kantar Public UK – who undertake marketing research, social surveys, and also specialise in consultancy, public opinion data, policy and also economy polling, among other things
One problem with the aim of the survey is that satisfaction is an elusive concept – a subjective experience that is not easily definable, accessible or open to precise quantitative measurement. The selection of responses available to participants and how these are measured and presented also affected the survey outcome.
For example, two categories of responses were conflated on the main report, with ‘satisfied’ and ‘fairly satisfied’ being presented as just one category – which gives the impression that people are fully satisfied. However, a ‘fairly satisfied’ response indicates that it is to some degree or extent but not fully, very or extremely satisfied. The presented survey findings, therefore, don’t distinguish between those who are fully satisfied with their interaction with the Department and those satisfied only to a moderate extent. Conflating these responses doesn’t provide us with the accurate ‘measurement’ of claimant satisfaction that the report claims.
Furthermore, statistics that are not fully or adequately discussed in the survey report – these were to be found tucked away in the Excel data tables which were referenced at the end of the report – and certainly not cited by Government ministers, are those particularly concerning problems and difficulties with the Department for Work and Pensions that arose for some claimants.
It’s worrying that 51 per cent of all respondents across all types of benefits who experienced difficulties or problems in their dealings with the Department for Work and Pensions did not see them resolved. A further 4 per cent saw only a partial resolution, and 3 per cent didn’t know if there had been any resolution.
In the job seeker’s allowance (JSA) category, some 53 per cent had unresolved problems with the Department and only 39 per cent had seen their problems resolved. In the Employment and Support Allowance (ESA) group, 50 per cent had unresolved problems with the Department, and in the Personal Independent Payment (PIP) group, 57 per cent of claimants had ongoing problems with the Department, while only 33 per cent have seen their problems resolved.
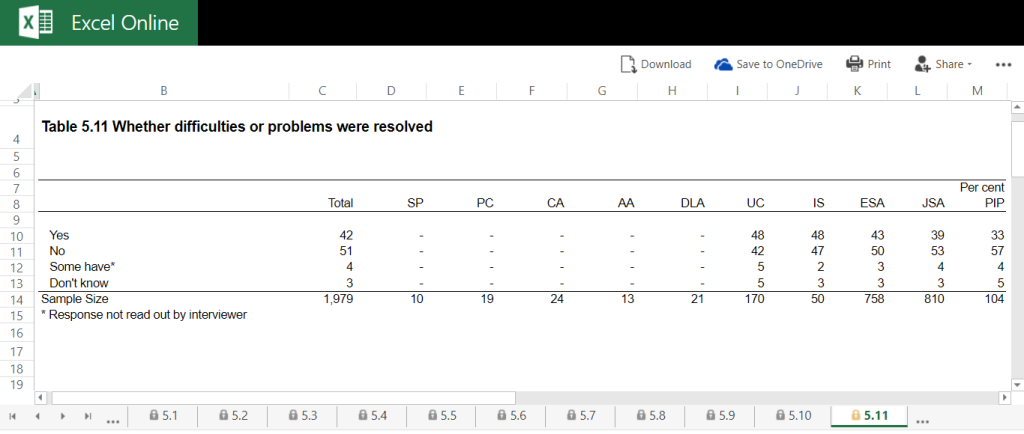
– means the sample size is less than 40.
Government officials have tended to select one set of statistics from the whole survey: “The latest official research shows that 76% of PIP claimants and 83% of ESA claimants are satisfied with their overall experience.” (Spokesperson for the Department for Work and Pensions.)
One problem with this is firstly it overlooks the problems outlined above, giving the impression that people don’t have any problems with the Department. Secondly, the survey conflates two sets of responses to come up with the overall percentages.
The positive categories for responses are “satisfied” and “fairly satisfied”. Given the problem of interpreting and precisely expressing subjective states like satisfaction, there is also the problem of measuring degrees of subjective states. There is some difficulty with “fairly satisfied” responses, as they may simply indicate that people experienced some difficulties, but these were handled politely by the Department. There may be varied reasons why people chose this category.
Some people are more likely to try to see situations positively. It tells us nothing about outcomes for those people. The questionnaires were closed – meaning responses were limited to a small number of simple response categories. So the responses don’t have a particularly helpful context of meaning to help us understand them.
Some basic problems with using closed questions in a survey:
- It imposes a limited framework of responses on respondents
- The survey may not have the exact answer the respondent wants to give
- The questions lead and limit the scope of responses
- Respondents may select answers which are simply the most similar to their “true” response – the one they want to give but can’t because it isn’t in the response options – even though it is different
- The options presented may confuse the respondent
- Respondents with no opinion may answer anyway
- Does not provide us with information about whether or not the respondent actually understood the question being asked, or if the survey response options provided include an accurate capture and reflection of the respondents’ views.
Another problem which is not restricted to the use of surveys in research is the Hawthorne effect. This is a well-documented phenomenon that affects many areas of research and experiment in social sciences. It is the process where human subjects taking part in research change or modify their behaviour, simply because they are being studied. This is one of the most difficult inbuilt biases to eliminate or account for in research design. This was a survey conducted mostly over the telephone, which again introduces the risk of an element of ‘observer bias.’
Furthermore, the respondents in this survey had active, open benefit claims or had registered a claim. This may have had some effect on their responses, since they may have felt they were being scrutinised by the Department for Work and Pensions. Social relationships between the observer and the observed ought to be assessed when performing any type of social analysis and especially when there may be a perceived imbalanced power relationship between an organisation and the respondents, in any research that they conduct or commission.
Given the punitive nature of welfare policies, it is very difficult to determine the extent to which fear of reprisal may have influenced peoples’ responses, regardless of how many reassurances participants were given regarding anonymity in advance.
The important bit about sampling practices: the changed sampling criteria impacted the results
The report states clearly: “The proportion of Personal Independence Payment customers who were ‘very dissatisfied’ fell from 19 per cent to 12 per cent over the same period.
Then comes the killer: “This is likely to be partly explained by the inclusion in the 2014/15 sample of PIP customers who had a new claim disallowed who have not been sampled for the study since 2015/16. This brings PIP sampling into line with sampling practises for other benefits in the survey.
In other words, those people with the greatest reason to be very dissatisfied with their contact with the Department for Work and Pensions – those who haven’t been awarded PIP or ESA, for example – are not included in the survey.
This introduces a problem in the survey called sampling bias. Sampling bias undermines the external validity of a survey (the capacity for its results to be accurately generalised to the entire population, in this case, of those claiming PIP and ESA). Given that people who are not awarded PIP and ESA make up a significant proportion of the PIP customer population who have registered for a claim, this will skew the survey result, slanting it towards positive responses.
Award rates for PIP (under normal rules, excluding withdrawn claims) for new claims are 46 per cent. However, they are higher for one group – 73 per cent for Disability Living Allowance (DLA) reassessment claims. This covers PIP awards made between April 2013 and October 2016. Nearly all special rules (for those people who are terminally ill) claimants are found eligible for PIP.
If an entire section of the PIP claimant population are excluded from the sample, then there are no adjustments that can produce estimates that are representative of the entire population of PIP claimants.
The same is true of the other groups of claimants. If those who have had a new claim disallowed (and again, bearing in mind that only 46 per cent of those new claims for PIP resulted in an award), then that excludes a considerable proportion of claimants registering across all types of benefits who were likely to have registered a lower level of satisfaction with the Department because their claim was disallowed. This means the survey cannot be used to accurately track the overall performance of the Department or monitor in terms of whether it is fulfilling its customer charter commitments. The survey excludes the possibility for monitoring and scrutinising Department decision-making and clamaint outcomes when the decision reached isn’t in the claimant’s favour..
The report clearly states: “There was a revision to sample eligibility criteria in 2014/15. Prior to this date the survey included customers who had contacted DWP within the past 6 months. From 2014/15 onwards this was shortened to a 3 month window. This may also have impacted on trend data.”
We have no way of knowing why those peoples’ claim was disallowed. We have no way of knowing if this is due to error or poor administrative procedures within the Department. If the purpose of a survey like this is to produce a valid account of levels of ‘customer satisfaction’ with the Department, then it must include a representative sample of all of those ‘customers’, and include those whose experiences have been negative.
Otherwise the survey is reduced to little more than a PR exercise for the Department.
The sampling procedure is therefore a way of only permitting an unrepresentative sample of people to participate in a survey, who are likeliest to produce the most positive responses, because their experiences have been of a largely positive outcome within the survey time frame. If those who have been sanctioned are also excluded across the sample, then this will also hide the experiences and comments of those most adversely affected by the Department’s policies, decisions and administration procedures, again these are claimants who are the likeliest to register their dissatisfaction in the survey.
Measurement error occurs when a survey respondent’s answer to a survey question is inaccurate, imprecise, or cannot be compared in any useful way to other respondents’ answers. This type of error results from poor question wording and questionnaire construction. Closed and directed questions may also contribute to measurement error, along with faulty assumptions and imperfect scales. The kind of questions asked may also have limited the scope of the research.
For example, there’s a fundamental difference in asking questions like “Was the advisor polite on the telephone?” and “Did the decision-maker make the correct decision about your claim?”. The former generates responses that are relatively simplistic and superficial, the latter is rather more informative and tells us much more about how well the DWP fulfils one of its key functions, rather than demonstrating only how politely staff go about discussing claim details with claimants.
This survey is not going to produce a valid range of accounts or permit a reliable generalisation regarding the wider populations’ experiences with the Department for Work and Pensions. Nor can the limited results provide meaningful conclusions to inform a genuine learning opportunity and support a committment to improvement for the Department.
With regard to the department’s Customer Charter, this survey does not include valid feedback and information regarding this section in particular:
Getting it right
We will:
• Provide you with the correct decision, information or payment
• Explain things clearly if the outcome is not what you’d hoped for
• Say sorry and put it right if we make a mistake
• Use your feedback to improve how we do things
One other issue with the sampling is that the Employment and Support Allowance (ESA) and Job Seeker’s Allowance (JSA) groups were overrepresented in the cohort.
The sample was intentionally designed to overrepresent these groups in order to allow “robust quarterly analysis of these benefits”, according to the report. However, because a proportion of the cohort – those having their benefit disallowed – were excluded in the latest survey and not the previous one, so cross comparision and establishing trends over time is problematic.
Kantar do say: “When reading the report, bear in mind the fact that customers’ satisfaction levels are likely to be impacted by the nature of the benefit they are claiming. As such, it is more informative to look at trends over time for each benefit rather than making in-year comparisons between benefits.”
With regard to my previous point, Kantar also say: “Please also note that there was a methodological change to the way that Attendance Allowance, Disability Living Allowance and Personal Independence Payment customers were sampled in 2015/16 which means that for these benefits results for 2015/16 are not directly comparable with previous years.”
And: “As well as collecting satisfaction at an overall level, the survey also collects data on customers’ satisfaction with specific transactions such as ‘making a claim’, ‘reporting a change in circumstances’ and ‘appealing a decision’ (along with a number of other transactions) covering the remaining aspects of the DWP Customer Charter.These are not covered in this report, but the data are presented in the accompanying data tabulations.”
The survey also covered only those who had been in touch with DWP over a three month period shortly prior to the start of fieldwork. As such it is a survey of contacting customers rather than all benefits customers.
Again it is problematic to make inferences and generalisations about the levels of satisfaction among the wider population of claimants, based on a sample selected by using such a narrow range of characteristics.
The report also says: “Parts of the interview focus on a specific transaction which respondents had engaged in (for example making a claim or reporting a change in circumstances). In cases where a respondent had been involved in more than one transaction, the questionnaire prioritised less common or more complex transactions. As
such, transaction-specific measures are not representative of ALL transactions conducted by DWP”.
And regarding subgroups: “When looking at data for specific benefits, the base sizes for benefits such as Employment and Support Allowance and Jobseeker’s Allowance (circa 5,500) are much larger than those for benefits such as Carer’s Allowance and Attendance Allowance (circa 450). As such, the margins of error for Employment and Support Allowance and Jobseeker’s Allowance are smaller than those of other benefits and it is therefore possible to identify relatively small changes as being statistically significant.”
Results from surveys are estimates and there is a margin of error associated with each figure quoted in this report. The smaller the sample size, the greater the uncertainty.
In fairness, the report does state: “In the interest of avoiding misinterpretation, data with a base size of less than 100 are omitted from the charts in this report.”
On non-sampling error, the report says: “Surveys depend on the responses given by participants. Some participants may answer questions inaccurately and some groups of respondents may be more likely to refuse to take part altogether. This can introduce biases and errors. Nonsampling error is minimised by the application of rigorous questionnaire design, the use of skilled and experienced interviewers who work under close supervision and rigorous quality assurance of the data.
Differing response rates amongst key sub-groups are addressed through weighting. Nevertheless, it is not possible to eliminate non-sampling error altogether and its impact cannot be reliably quantified.”
As I have pointed out, sampling error in a statistical analysis may also arise from the unrepresentativeness of the sample taken.
The survey response rates were not discussed either. In the methodological report, it says: “In 2015/16 DWP set targets each quarter for the required number of interviews for each benefit group to either produce a representative proportion of the benefit group in the eventual survey or a higher number of interviews for sub-group analysis where required. It is therefore not strictly appropriate to report response rates as fieldwork for a benefit group ceased if a target was reached.”
The Government says: “This research monitors claimants’ satisfaction with DWP services and ensures their views are considered in operational and policy planning.”
Again, it doesn’t include those claimants whose benefit support has been disallowed. There is considerable controversy around disability benefit award decisions (and sanctioning) in particular, yet the survey does not address this important issue, since those experiencing negative outcomes are excluded from the survey sample. We know that there is a problem with the PIP and ESA benefits award decision-making processes, since a significant proportion of those people who go on to appeal DWP decisions are subsequently awarded their benefit.
The DWP, however, don’t seem to have any interest in genuine feedback from this group that may contribute to an improvement in both performance and decision-making processes, leading to improved outcomes for disabled people.
Last year, judges ruled 14,077 people should be given PIP against the government’s decision not to between April and June – 65 per cent of all cases. The figure is higher still when it comes to ESA (68 per cent). Some 85 per cent of all benefit appeals were accounted for by PIP and ESA claimants.
The system, also criticised by the United Nations because it “systematically violates the rights of disabled persons”, seems to have been deliberately set up in a way that tends towards disallowing support awards. The survey excluded the voices of those people affected by this government’s absolute callousness or simple bureaucratic incompetence. The net effect, consequent distress and hardship caused to sick and disabled people is the same regardless of which it is.
Given that only 18 per cent of PIP decisions to disallow a claim are reversed at mandatory reconsideration, I’m inclined to think that this isn’t just a case of bureaucratic incompetence, since the opportunity for the DWP to rectify mistakes doesn’t result in subsequent correct decisions, in the majority of cases, for those refused an award.
Without an urgent overhaul of the assessment process by the Government, the benefit system will continue to work against disabled people, instead of for them.
The Government claim: “The objectives of this research are to:
- capture the views and experiences of DWP’s service from claimants, or their representatives, who used their services recently
- identify differences in the views and experiences of people claiming different benefits
- use claimants’ views of the service to measure the department’s performance against its customer charter”
The commissioned survey does not genuinely meet those objectives.
“There is an alternative reality being presented by the other side. The use of figures diminishes disabled peoples’ experiences.”
—
You can read my full analysis of the survey here: A critique of the government’s claimant satisfaction survey
I don’t make any money from my work. I am disabled because of illness and have a very limited income. But you can help by making a donation to help me continue to research and write informative, insightful and independent articles, and to provide support to others. The smallest amount is much appreciated – thank you.
![]()


Reblogged this on sdbast.
LikeLiked by 1 person
I have forwarded to the Alliance. Andrew
LikeLiked by 2 people
I think that the government need to be called out on the pseudopositivist clap trap, boardroom psychology, complete with psychobabble and managementspeak. I’m just writing another piece about their lack of research rigour, their disregard of empirical evidence and their tactic of dismissing citizens’ accounts, charities, academics, credible researchers and empirical findings that don’t fit with their ideology as ‘scaremongering’, ‘anecdotal evidence’ , ‘doesn’t demonstrate a ‘causal link” , ‘supports Momentum’ and so on. It’s epistemological totalitarianism, political gaslighting and we need to seriously challenge it
LikeLike
Kitty,
I agree with you that this survey is just nonsense. When you know your system is a complete shambles you don’t survey your customers to find out how good you are.
The positive news is that Scotland is developing its own Social Security system for disability and as with previous work it’s engaging with its customer. We had a great success with our Private Rented sector housing going from Six months to indefinite Tenancies.
When people work together the impossible is often achieved.
Regards, Stephen
Stephen WA Baxter BSc PgD IET 01355 225328 47 G74 2BA
>
LikeLiked by 2 people
Reblogged this on disabledsingleparent.
LikeLike
Reblogged this on Christopher John Ball and commented:
Great work by Kitty Jones – Please read and share
LikeLike
I hate the DWP with a passion, every time I contact them by email, my chosen method of contact, they reply with contact us by phone on this or that number, to which I threaten them with a court and not making reasonable adjustments, or having to pay compensation for not allowing contact by email. They always give in and have done since 2007. If you tell them you are recording the call a lot just hang up so email is the preferred option for me.
I always put on any contact letter or form, ALL VERBAL COMMUNICATION WILL BE AUDIO RECODED so they know that any contact with them will be recorded. They don’t like it and I always carry out any actions that I say I will do if they don’t comply and they always do comply.
LikeLike
I love reading through your work. Thank-goodness we have people like you, capable of analysing government statistics … and how they are spun … Keep up the good work. Thank you very much for this post, Paul Snowdon.
On 13 February 2018 at 11:06, Politics and Insights wrote:
> Kitty S Jones posted: ” The Department for Work and Pensions Claimant > Service and Experience Survey (CSES) is described as “an ongoing > cross-sectional study with quarterly bursts of interviewing. The survey is > designed to monitor customers’ satisfaction with the service offere” >
LikeLiked by 1 person
I had a telephone call yesterday from company carrying out del satisfaction survey.
This was a total load of rubbish, as I told the lady who rang me, the dwp will cherry pick the best information and ignore the rest.
The question on whether I had contacted dwp by phone was laughably irrelevant, as it asked was the person knowledgeable, as we only rang to say we’d be recording medical it didn’t take much knowledge, there again when we got to the medical the assessor did not have a note of this, so perhaps a no?!? I would call this incompetence not lack of knowledge.
I found the questions would not give any idea of customer satisfaction and basically thought it a total waste of tax payers money (as are assessments by capita and sits in my opinion)
I also could not understand why whether or not I used certain types of social media was irrelevant.
LikeLike
This article does not expose the fact that the UK denies 4% of its pensioners an uprating of their pensions. The government dishonestly claims it cannot afford £600Million to uprate all its pensioners pensions, and yet it does not tell us the NI fund has a credit balance of £27 Billion which is £10Billion above the Actuary’s prudential balance. Furthermore, the NI balance is forecast to increase by >£30Billion to >£60Billion in 5 years by 2024, and the DWP wishes us to believe it cannot afford £600Million each year to fairly uprate the 4% of its frozen pensioners, 95% of whom are retired overseas in Commonwealth nation. By living overseas this is saving the UK’s budget at least £1500/retiree/year. All the figures here are from https://assets.publishing.service.gov.uk/government/uploads/system/uploads/attachment_data/file/771441/CCS207_CCS1218213668-001_GA_Uprating_Report_2019_Web.pdf.
Finally a 0.6% increase in NI contributions costing the average pay-packet just 40Pence [i.e.1fag /week] would fund the required £600Million to ensure all the UK’s pensioners are treated equally and fairly.
LikeLike
That is because the government commissioned research that this article critiqued is about working age social security and not pensions
LikeLike