Tag: Gini coefficient

UK has shameful but unsurprising levels of inequality


1459720_569627496440116_902730897_n

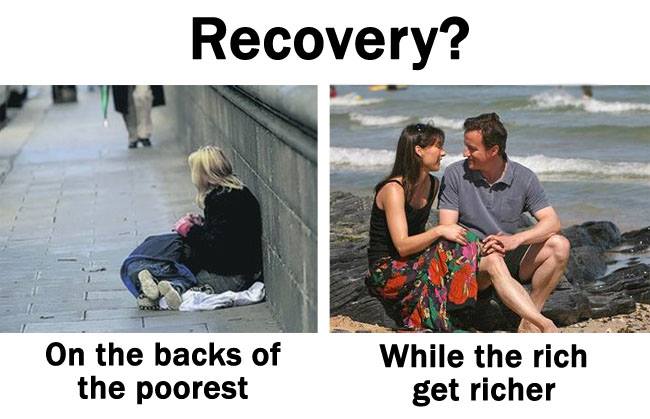
Austerity was never about what works or what is needed. It’s about traditional Tory class-based prejudices. Austerity is simply a front for policies that are entirely founded on Tory ideology, which is  all about handouts to the wealthy that are funded by the poor.

David Cameron has often denied claims that his party has overseen a rapid rise in inequality. In fact last year, Cameron said that inequality is at its lowest level since 1986. I really thought I’d misheard him. 

This wasn’t the first time Cameron has used this lie. We have a government that provides disproportionate and growing returns to the already wealthy, whilst imposing austerity cuts on the very poorest. How can such a government possibly claim that inequality is falling, when inequality is so fundamental to their ideology and when social inequalities are extended and perpetuated by all of their policies? It seems that the standard measure of inequality has been used to mislead us into thinking that the economy is far more “inclusive’ than it is. Yet the UK is one of the wealthiest nations in the world.

Earlier this year a published report by the Dublin-based Foundation for the Improvement of Living and Working Conditions (Eurofound) stated that the UK has become the most unequal country in Europe, on the basis of income distribution and wages.

The report also says that the UK has the highest Gini coefficient of all European Union (EU) member states – and higher than that of the US. The coefficient is a widely used measure of the distribution of income within a nation, and is commonly used to calculate inequality.

A year ago, the Organisation for Economic Cooperation and Development (OECD) published research that confirmed what most of us already knew: that income inequality actually stifles economic growth in some of the world’s wealthiest countries, whilst the redistribution of wealth via taxes and benefits encourages growth. That debunks one of the nastiest Tory myths. Having long been advocates and engineers of social inequality, implying a mythological  “trickle down” as a justification, and hankering after a savage, axe-wielding minarchism, chopping away at our civilising public services and institutions, they are now officially a cult of vicious cranks. The problem is that the general public don’t pay much attention to research like this. They really ought to.

Conservatism is centred around the preservation of traditional social hierarchy and inequality. Tories see this, erroneously, as an essential element for expanding national economic opportunity. But never equal opportunity.

Conservatives think that civilised society requires imposed order, control and clearly defined classes, with each person aware of their rigidly defined “place” in the social order. Conservatism is a gate-keeping exercise geared towards economic discrimination and preventing social mobility for the vast majority. Inequality is so clearly embedded in policies – which are written statements of political intent.

According to the annual Family Spending Review for 2014, published by  the Office for National Statistics (ONS), the richest 1 per cent of the population have as much wealth as the poorest 57 per cent combined.  Wealth inequality has increased since 2012. The richest 10 per cent own half the country’s wealth.

Charities have urged the government to address Britain’s shameful and growing inequality after the figures published this week show that the country’s richest 10 per cent spend as much on alcohol and cigarettes in a week as the poorest spend on gas and electricity. That turns the dominant “feckless” poor narrative in the media on its head. Poverty doesn’t happen because people have poor budgeting skills. Poverty happens because people don’t have enough money to meet their basic needs.

The richest 10 per cent of households spent more per week on furniture – an average of £43.40 – than the poorest spent on food – £30.40.

The average weekly household spend was found to be £531.30, but there was great variation of this amount between the highest and lowest earning 10 per cent – £1,143.40 and £188.50 per week respectively.

By 2011/12, the poorest fifth of households spent 29 per cent of their disposable income on indirect taxes, compared with 14 per cent paid by the richest fifth. All told, the poorest households pay 37 per cent of their gross income in direct and indirect taxes. In other words, the single biggest expenditure for people in poverty is tax. It is, at the very least, morally unjustifiable to be taxing the poor at such a rate. The most important thing the government can do to help the poor is to stop taking their money.

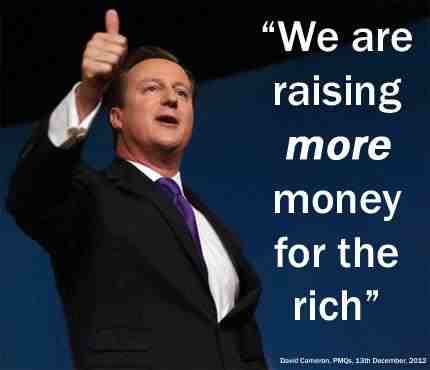
David Cameron did once tell a truth, though it was an inadvertent Freudian-styled slip. He said: We are raising more money for the rich. Yes. From where, I wonder?

Oh yes. The poor.

 382035_141704259313964_676863845_n


 Pictures courtesy of Robert Livingstone


Labour’s excellent record on poverty and inequality

miliband country in decline

Originally published by the Fabian Society on Friday, 9 October 2009.

Perhaps the most audacious aspect of David Cameron’s speech to the Conservative Party conference this year was his attempt, while reconnecting with Thatcherism, also to project his party as the party of the poor.

Part of this strategy involves presenting Labour’s record on inequality and poverty as one of downright failure.

So what is the reality? What is Labour’s record on poverty and inequality?

The place to look for reliable data on this topic are the regular publications by the IFS. Reviewing them, these seem to be the key facts.

(1) Inequality increased enormously under the Conservatives. The Gini coefficient, a standard measure of inequality, rose from around 0.25 for income inequality in 1979 to around 0.34 in the early 1990s. In the IFS’s words: ‘The scale of this rise in inequality has been shown…to be unparalleled both historically and compared with changes taking place at the same time in most other developed countries’ (Brewer et al, 2008, p.27).

David Cameron joked about the way Labour refers to the ‘wicked Tories’. Well, there’s a reason for that. The last time they held power for a significant period of time they produced an ‘unparalleled’ increase in income inequality.

(2) Yes, inequality has increased under Labour. The Gini rose to 0.35 under Labour’s first term, then fell in the second term, back to where it had been in 1996/7 (about 0.33). In Labour’s third term, inequality has increased again and is estimated at about 0.36 for 2007/8, higher than at any time since the relevant records began in 1961 (Brewer et al, 2009, pp.23-24).

(3) But Labour has been consistently redistributive. IFS analyses show repeatedly, however, that Labour’s budgets have been consistently redistributive in their effects. That is to say, if you look at who has gained and lost from the changes to the tax-benefit system since 1996/7, the gains are biggest at the bottom, disappear in the middle, with losses at the top (Phillips, 2008).

(4) And Labour has (probably) reduced ‘counterfactual’ income inequality. To assess the impact of Labour’s policies since 1996/7, it is not enough to just look at where inequality is now compared to then. One has to ask: Where would inequality be now if we had just continued with the old tax-benefit system inherited from the Conservatives (with appropriate adjustments for inflation and the like)?

In Poverty and Inequality in the UK: 2007, IFS researchers calculated what the Gini for income inequality would be in 2005/6 under unchanged Conservative policies. The actual Gini in 2005/6 was 0.347. The ‘counterfactual’ Gini, reflecting unchanged Conservative policies, was 0.378 (Brewer et al, 2007, p.22). I have not managed to find a more recent calculation of this sort.

But up to 2005/6 at least, it seems that Labour’s redistributive budgets were preventing inequality rising by as much as it would otherwise have done – as much as it would have done under the policy regime inherited from the Conservatives.

(5) Poverty, on most indicators, is lower for most groups than when Labour came to office. If we turn from inequality to poverty, the basic story seems to be, first, that on most measures, and for most groups (children, pensioners, etc.), poverty rates are lower than in 1996/7 (Brewer et al, 2009, pp.34-36). Accordingly, I would judge any broad-brush claim that ‘Poverty has increased under Labour’ or that ‘Labour has been bad for the poor’ as risible.

The usual headline measures of poverty focus on those with incomes less than 60% of the median. One Conservative line of attack has been to switch the attention to those in ‘severe’ poverty, defined as those with incomes less than 40% of the median. Analysis shows that ‘severe’ poverty rates have increased since 1996/7. However, the most recent IFS report on this subject argues that the data on those with incomes at this level is hard to interpret. Many of those in this group record expenditure well above their income level, suggesting that they might be on temporary low incomes and using savings or borrowing in expectation of higher income to maintain their living standards.

There might also be some recording error. The IFS researchers are thus sceptical that we should regard those in this group in general as really in ‘severe’ poverty (see Brewer et al, 2009, p.32).

(6) Labour’s third term has been bad for poverty reduction. Labour’s progress on reducing poverty went into reverse in its third term. Looking across the various groups (children, pensioners, etc.), poverty rates are higher now than they were in 2004/5 (Brewer et al, 2009, pp.32-34), though still lower for most groups than in 1996/7.

It should be noted, however, that IFS researchers expect child poverty to fall by 500-600,000 up to 2010/11, on the basis of existing policies and allowing for likely economic changes (Brewer, Browne, Joyce and Sutherland, 2009).

Overall, then?

Labour has (1) pursued consistently redistributive policies – it has shifted resources from rich to poor – and these policies (2) have had some effect in reducing poverty and (3) have probably helped to check, without altogether preventing (let alone reversing), increased inequality.

The Conservatives say they can do better. But, as part of the rhetoric of ‘progressive Conservatism’, they also tend to downplay the role of redistribution in tackling poverty and inequality. For they want the ‘progressive end’ of reduced poverty or inequality while using ‘conservative means’ (i.e., not redistribution).

To test what you think about this claim it helps to consider the ‘counterfactual’ exercise I mentioned above: If the Conservative approach – eschewing greater redistribution – had been applied since 1997, in place of Labour’s consistently redistributive approach, do you think poverty and/or inequality would be lower today or higher?

I think the question just about answers itself.

Related:

Cameron’s Gini and the hidden hierarchy of worth

Inequality has risen: Incomes increased for the richest last year, but fell for everyone else

Ed Miliband interview: The biggest issue we face is inequality

UK Wealth Divide widens, with inequality heading for “most unequal country in the developed world”

1379986_541109785958554_2049940708_nMany thanks to Robert Livingstone for his excellent memes